> A Gantt chart is a type of bar chart, first developed by Karol Adamiecki in 1896, and independently by Henry Gantt in the 1910s, that illustrates a project schedule and the amount of time it would take for any one project to finish. Gantt charts illustrate number of days between the start and finish dates of the terminal elements and summary elements of a project.
Gantt Charts will record each scheduled task as one continuous bar that extends from the left to the right. The x axis represents time and the y records the different tasks and the order in which they are to be completed.
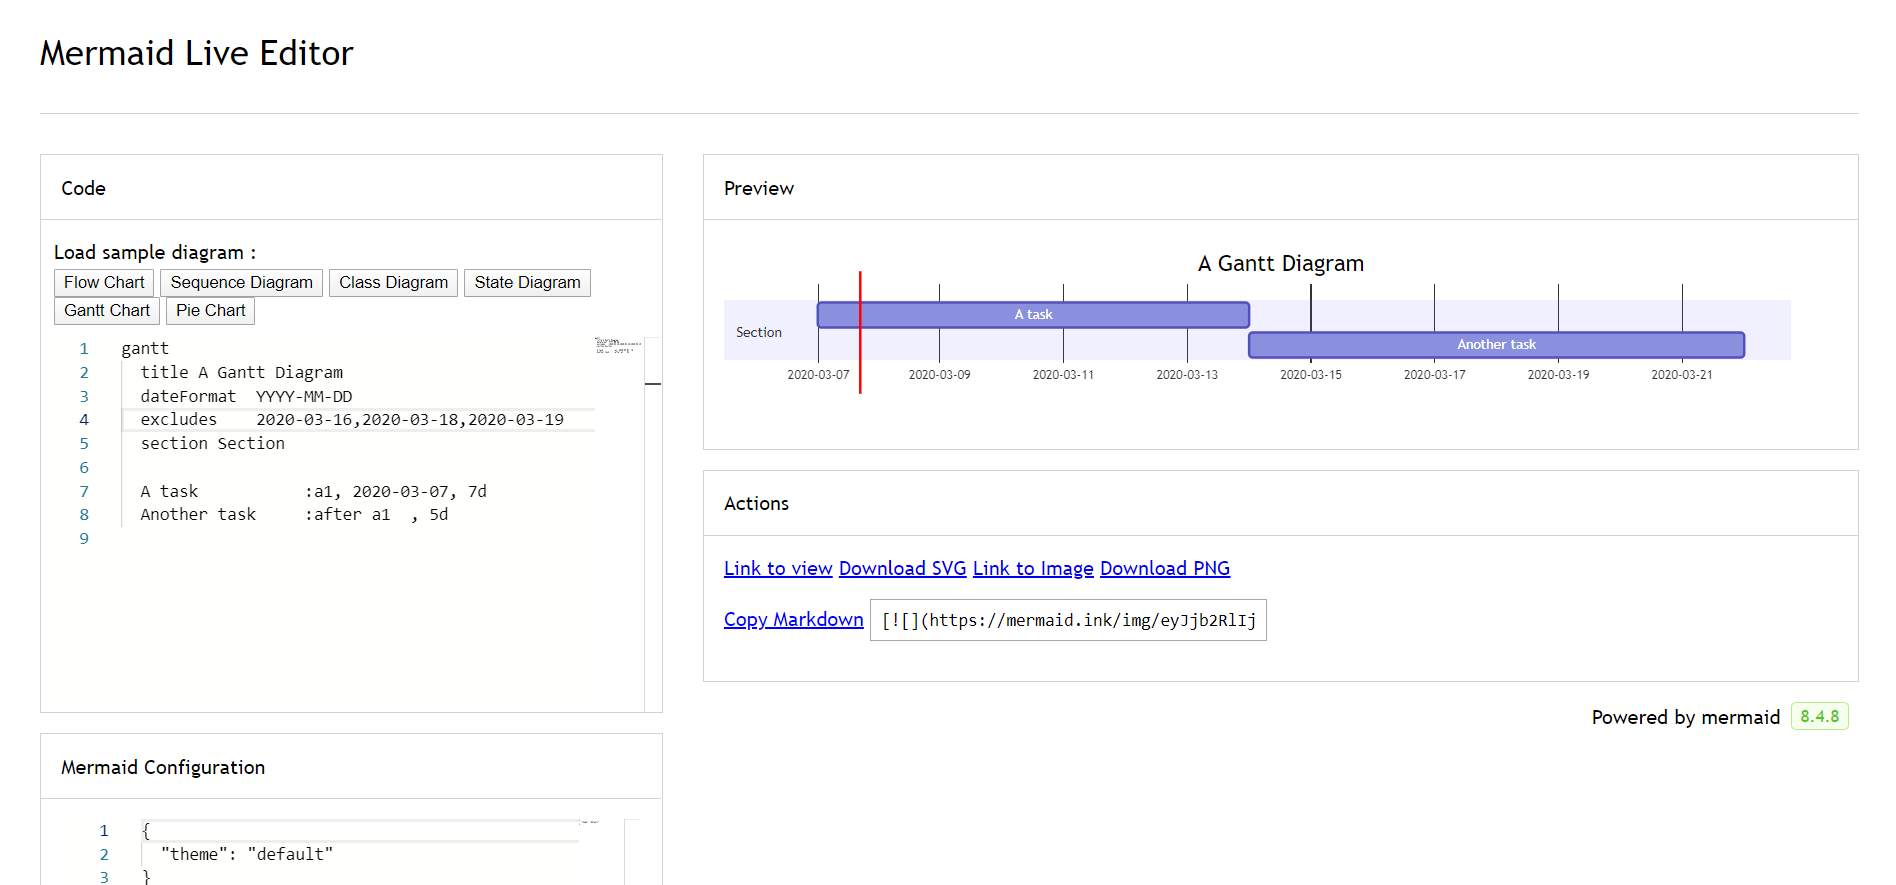
It is important to remember that when a date, day, or collection of dates specific to a task are "excluded", the Gantt Chart will accomodate those changes by extending an equal number of day, towards the right, not by creating a gap inside the task.
As shown here 
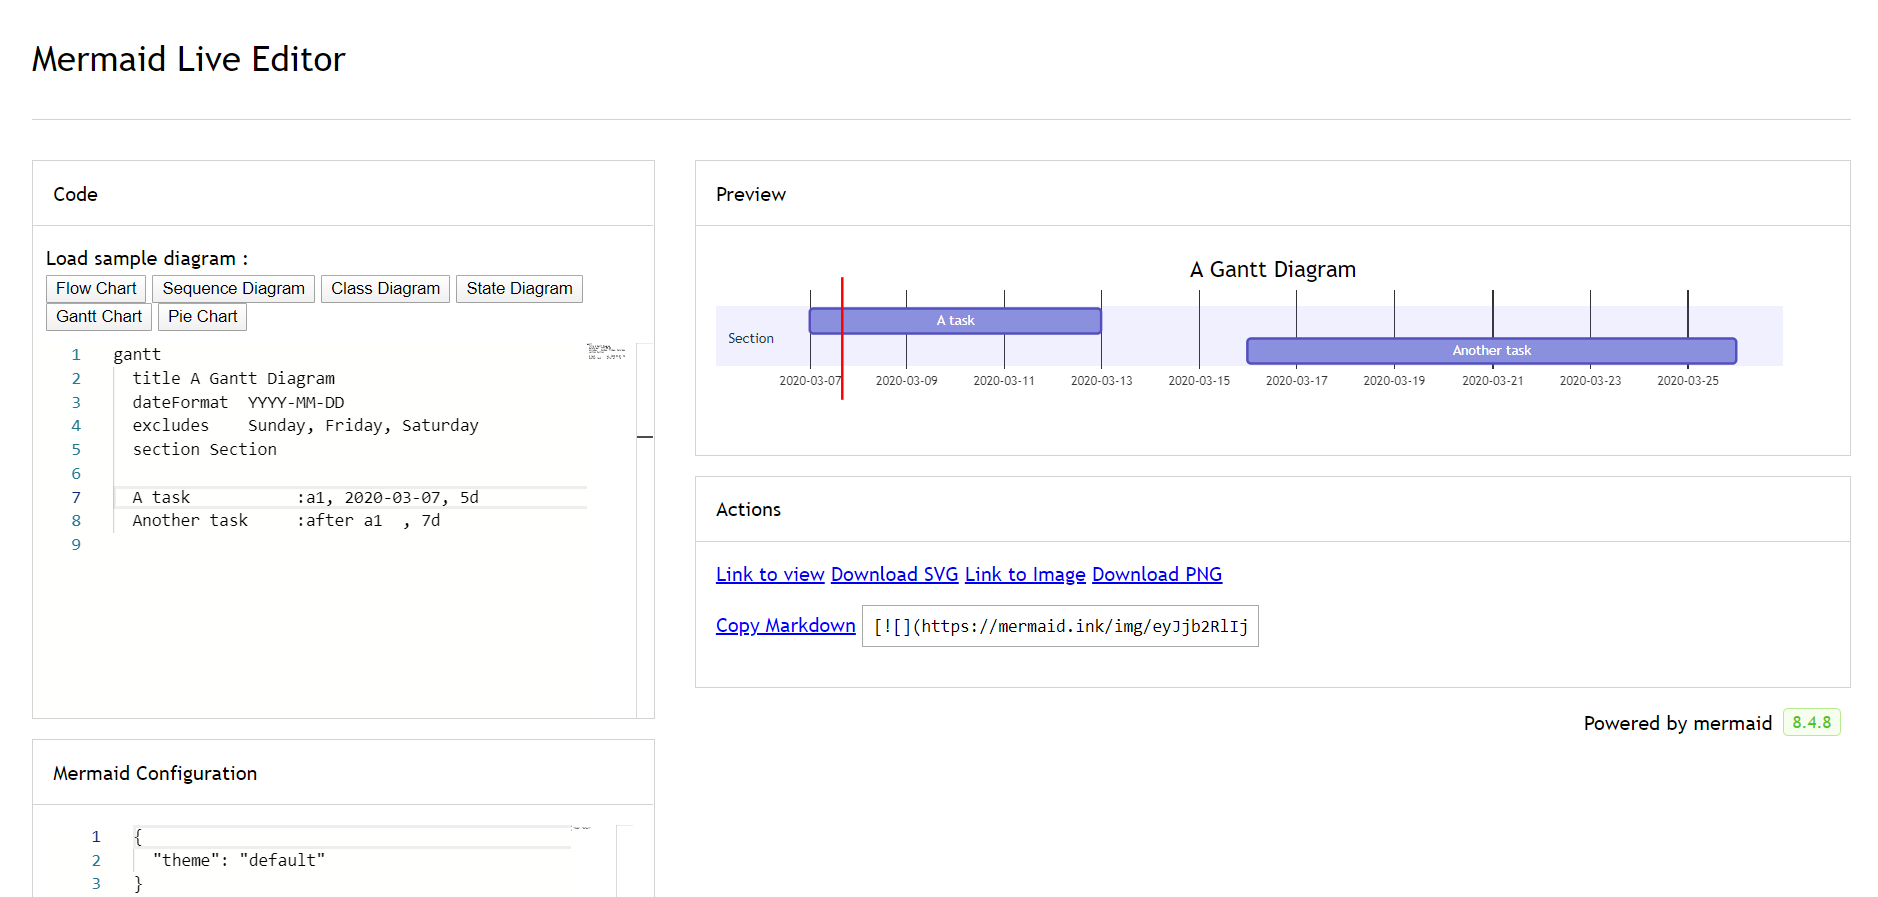
However, if the excluded dates are between two tasks that are set to start consecutively, the excluded dates will be skipped graphically and left blank, and the following task will begin after the end of the excluded dates.
As shown here 
A Gantt chart is useful for tracking the amount of time it would take before a project is finished, but it can also be used to graphically represent "non-working days", with a few tweaks.
Mermaid can render Gantt diagrams as SVG, PNG or a MarkDown link that can be pasted into docs.
You can divide the chart into various sections, for example to separate different parts of a project like development and documentation.
To do so, start a line with the `section` keyword and give it a name. (Note that unlike with the [title for the entire chart](#title), this name is *required*.
`dateFormat` defines the format of the date **input** of your gantt elements. How these dates are represented in the rendered chart **output** are defined by `axisFormat`.
Comments can be entered within a gantt chart, which will be ignored by the parser. Comments need to be on their own line, and must be prefaced with `%%` (double percent signs). Any text after the start of the comment to the next newline will be treated as a comment, including any diagram syntax
Is it possible to adjust the margins for rendering the gantt diagram.
This is done by defining the `ganttConfig` part of the configuration object.
How to use the CLI is described in the [mermaidCLI](mermaidCLI.html) page.
mermaid.ganttConfig can be set to a JSON string with config parameters or the corresponding object.
```javascript
mermaid.ganttConfig = {
titleTopMargin:25,
barHeight:20,
barGap:4,
topPadding:75,
sidePadding:75
}
```
### Possible configration params:
Param | Descriotion | Default value
--- | --- | ---
mirrorActor|Turns on/off the rendering of actors below the diagram as well as above it|false
bottomMarginAdj|Adjusts how far down the graph ended. Wide borders styles with css could generate unwantewd clipping which is why this config param exists.|1
It is possible to bind a click event to a task, the click can lead to either a javascript callback or to a link which will be opened in the current browser tab. **Note**: This functionality is disabled when using `securityLevel='strict'` and enabled when using `securityLevel='loose'`.
```
click taskId call callback(arguments)
click taskId href URL
```
* taskId is the id of the task
* callback is the name of a javascript function defined on the page displaying the graph, the function will be called with the taskId as the parameter if no other arguments are specified..
Beginners tip, a full example using interactive links in an html context: